|
|

Weather is a game changer, but by how much? We blame bad weather for low spring plant sales but don’t give good weather as much credit for higher sales. We complain about the weather, but where, statistically, is the evidence that good weather improves plant sales or, more importantly, bad weather decreases sales? Virtually no evidence has been published in the industry or peer-reviewed literature about the influence of weather on plant sales. There are probably some private forecasting models which have been developed for use, especially by larger companies with the expertise and data to analyze. Our goal was to provide some evidence about this long-held relationship between weather and plant sales.
We started with a review of what had been published about weather’s effect on sales. Studies conducted in other industries do incorporate weather into revenue forecasting. But we found virtually nothing published about the influence of weather on the sales of plants. Our objective was to define the relationship between several common weather variables and several categories of plant sales with the goal of developing sales forecasting models to help smaller retailers and growers more predictably forecast plant sales.
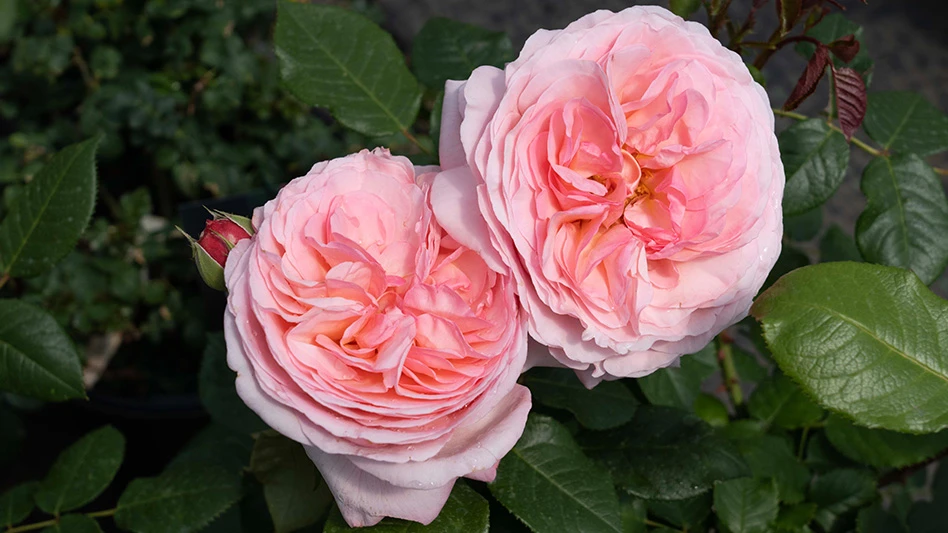
We believed that multiple weather parameters would be related to plant sales. Wanting to begin in a small geography with a short retail window, we sought data from Midwest growers and retailers. In the Midwest, cool or cold air temperatures (minimums) would likely delay purchase of summer plants (herbs, vegetables, and annuals) while warmer air temperatures (maximum) would likely promote plant purchases. We suspected that any precipitation (rain or snow) and lower minimum air temperatures would reduce sales (negative correlation) but that higher maximum air temperatures and abundant sunlight would improve sales (positive correlation). We also suspected that day of week and plant sales would be related, with greater sales on weekends and lower sales during weekdays. Finally, week number or month and sales would be positively related to a point (i.e., early in the season), and then a negative relationship would be observed (i.e., late in the season), especially with the short spring window of sales.
We obtained the voluntary participation of a plant producer who provided daily scan-based sales data from 42 Midwestern stores in Indiana, Ohio, and Michigan. The producer was the only supplier of flowering annual, herb, and vegetable transplants to the stores. Their seasonal plant sales areas were relatively similar in size and product mix, attached to the store, but not climate-controlled, except for overhead covering. Daily sales data were provided over a 12-week period (April 15 through July 15) for three years (2007 through 2009) from each store in two categories: herbs plus vegetable transplants combined (H+V) and flowering annual plants (FA). This time period was selected because, anecdotally, nearly all of the spring sales of herbs, vegetables, and annuals in this geographic area were most likely to occur in this time frame each year.
The stores were divided into four Midwest regions, based on ZIP code: Western Michigan, Southeastern Michigan and Northwestern Ohio, Mid-Michigan, and Mid-Indiana. We purchased daily weather measurements from AWIS Weather Services Inc. Measures included daily precipitation (hundredths of inches), minimum and maximum air temperatures, and a measure of sunlight (watt hours/m2). Weather measures were provided from the closest weather station to the retail store by ZIP code. Time series linear regression analysis was used to analyze the data (SAS autoregressive procedure). In examining the data, it was clear that there was a monthly or seasonal pattern, as well as a day-of-the week pattern, to sales.
Weather, location (region), weekday and month all affected sales of FA and H+V sales, with the exception of precipitation (Table 1). Region, weather and weekday accounted for only ~40 percent of the variance in daily sales of these Midwestern stores that merchandised plants under cover. Minimum air temperature slightly reduced H+V and FA sales, while increased maximum air temperature slightly increased sales. Increasing sunlight reduced sales 1 percent per watt hour/m2.
Sales of H+V and FA were higher in 2007 compared to 2009, but similar to 2008 except for FA. Daily sales of H+V were $44.56 higher in May compared to April and $16.91 lower in June and $17.53 lower July. Daily sales of FA were $116.98 higher in May and $22.68 lower in June and $27.14 lower in July. This was anticipated as a typical sales pattern for many annual transplants sold in the spring months in the Midwest. In addition, sales varied by day of the week. Not surprisingly, weekend sales (Saturday and Sunday) of H+V and FA were higher than weekday sales. Saturday sales were the single highest sales day for H+V and FA. The second highest sales of FA and H+V occurred on Sunday and third highest on Monday. Saturday sales of H+V were 312 percent higher than Wednesday sales and 349 percent higher for FA sales.
 Table 1. Multiple regression coefficients (p-value or significance), and goodness of fit results for variables related with plant sales data for herbs and vegetables (H+V) and flowering annuals (FA) from 42 Midwestern stores. Since the sales data were collected as dollars and cents, coefficients can be interpreted as dollars and cents. |
Additionally, we tested lags of up to seven days on daily sales and found that nearly all lags were not significant or had very minor influences. So, sales of the prior days did not influence the subsequent day’s sales.
Weather parameters do influence plant sales, but not to as great an extent as anecdotal evidence might suggest since the model accounted for ~40 percent of the sales variance. That means that weather, day of week, and other variables in this study accounted for approximately 40 percent of the variability. Other factors, not accounted for here, also influenced sales. We suspect one of those variables not accounted for in our study was the presence (or more importantly, absence) of a covering of the sales area.
Sales of H+V and FA were higher in 2009 compared to 2007; sales were also higher in May but lower in June and July compared to April. This made intuitive sense since that is a typical pattern for spring plant sales in the Midwest. The most profound relationship we found was that day-of-week had a more substantial effect on sales of FA and H+V than any weather parameters. Consistently, FA and H+V sales were highest on Saturday, enhancing daily sales by $3.12 or $3.49. Generally, FA and H+V sales were higher on weekend days (Saturday and Sunday) compared to weekdays.
In these stores, each degree increase in maximum air temperature increased daily sales nine or 19 cents per day. Precipitation had no effect on sales of either FA or H+V, probably because the sales area was covered. For practical inventory and labor management, weekday plays a greater and more easily predictive role on sales than weather. Deliveries and workers should be scheduled to anticipate the high plant sales on Saturday. Given the magnitude of effect of day-of-week on sales, a second delivery might be made during the weekend to further enhance those sales.
These data indicate there is a modest relationship between weather parameters and sales of FA and H+V, but a stronger and more predictable relationship between month and day-of-week on sales. Given the low amount of variance accounted for by our model, it would be of little value to help other growers and retailers in this area to predict sales.
Growers and retailers now have evidence that it isn’t just the weather that accounts for the wide variability in H+V and FA sales. Day of week plays a more substantial role. These results should encourage additional models be tested in other regions of the U.S. with additional independent and multi-location plant retailers. The amount of fully covered and partially covered (e.g. lath or other shade covering) sales area should be included in future models, since we suspect that covered area likely influenced the impact of weather parameters. In U.S. regions where plant sales are less concentrated in a few weeks, the influence of weather may also be different. Until then, the best predictor of FA and H+V sales will be the three-fold or greater effect Saturday has on sales and the tremendous impact May has.
Have a question? You can write Bridget at behe@msu.edu
Explore the April 2012 Issue
Check out more from this issue and find your next story to read.
Latest from Greenhouse Management
- Metrolina Greenhouses donated more than $1 million in 2024
- De Vroomen Garden Products celebrates 100 years with new products, global celebrations
- ThinkPlants announces new shrub program
- American Floral Endowment 2025 scholarship applications now open
- Two Proven Winners ColorChoice varieties take top honors in Australia’s 2025 Plant of the Year
- Registration now open for 2025 National Floriculture Forum
- GardenComm hosting 10-session Winter Webinar Series
- Growing beyond the greenhouse