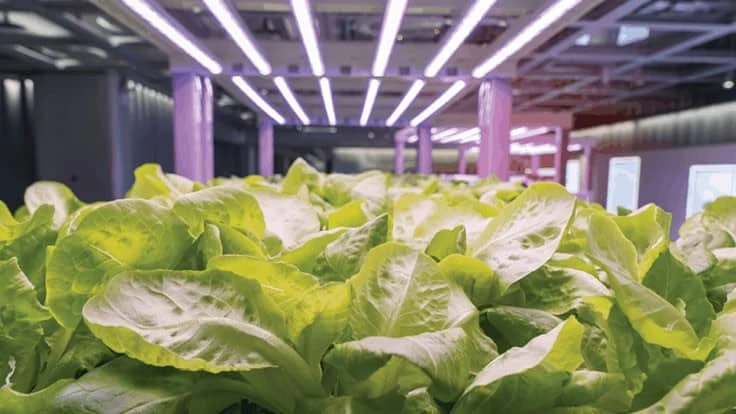

For growers considering supplemental lighting, cost is a major factor to consider, said Dr. Marc van Iersel, a professor at the University of Georgia and co-founder of Candidus, a supplemental lighting control company.
Recently, he hosted a webinar with GLASE titled, ‘Lighting approaches to maximize profits.’ It is available in full here.
Determining cost
GLASE, in coordination with the Cornell College of Agriculture and science, created a lighting cost calculator for supplemental lighting need.
“What this calculator does is show how much supplemental light you need over the course of a year in order to make sure your crop receives 17 mols of light. Seventeen mols is a common amount for growing lettuce,” van Iersel said in the webinar.
Using lettuce production as an example, the calculator outlines two different scenarios for growers depending on if they are growing in a poly greenhouse with an estimated 62% light transmittance rate or in a glass greenhouse with an estimated 70% transmittance rate. While the color-coded maps — which detail how much supplemental light is needed each year for a specific area — are similar, there are differences in certain parts of the U.S., including Texas, Oklahoma, Georgia and South Carolina.
He added that growers in glass greenhouses need less supplemental light because they receive more natural sunlight due to the higher transmittance rate.
“Once you know how much supplemental light you need to provide and you know how efficient your lighting system is, plus the cost of electricity, it becomes really easy to calculate cost,” van Iersel said.
The amount of mols needed does vary by crop. Tomatoes, for instance, have a DLI target of 25 mols. As a result, the map looks different even with the same transmittance rate.
“Tomatoes require more light,” van Iersel said. “It’s a lot more light as compared to lettuce.”
In the coming months, van Iersel said an online calculator for growers to determine costs for their specific zip code, crop and lighting type will become available. Neil Mattson, a researcher at Cornell, has also released a tool to help growers determine their lamp seeds. It is available at hortlamp.com

The importance of the Daily Light Integral
According to van Iersel, the DLI has been used in greenhouse production for roughly 30 years and is primarily used for lighting recommendations.
“I think the daily light integral and using recommendations based on it is really useful,” he said. “But one thing we’ve been able to show is not all daily light integrals are calculated equally. How you provide that light over the course of the day also matters.”
Van Iersel said this is because of natural light variation. The amount of light and its variations depending largely on a geographic region.
In the webinar, van Iersel compared Elmira, New York, and Phoenix, Arizona. Elmira’s varied greatly due to the changing weather based on the season. In the winter towards the end of the year, for instance, much less light (as measured in mols) was created naturally. So, a grower in Elmira would need more supplemental light. By comparison, Phoenix still saw a dip in natural light towards the end of the year. However, because Phoenix does not have the same winter climate as Elmira, it doesn’t drop off nearly as much. It also varied much less day-to-day over the course of a year.
“In Phoenix, because it is typically sunny all year, there is just must less variation,” he said. “But you still have less light in the winter.”
For growers, that means understanding how the daily light integral is applied in their specific region. In the webinar, van Iersel showed a rudbeckia study where the same DLI – in this case, 12 mols – was applied over four different time frames (12 hours, 15 hours, 18 hours and 21 hours) vs. a control group with no supplemental light. The results showed, generally speaking, that plant growth improved as the photoperiod expanded.
“What we found is that as we go from a 12-hour photo period to a 21-hour photo period, we got a 33% increase in above-ground growth,” he said. “We also got a 22% increase in root dry weight.”
As for profit, van Iersel said the key is to use this data and find the right balance of spending on lighting in relation to pricing.
Take-home message
One other note van Iersel offered is that current research suggests that stability is best when applying light. That means it is better to apply the same amount of light vs. a variation during a growing cycle. An overlooked tool in helping that is using different greenhouse control systems to keep light levels consistent.
He also said it is essential to work with a lighting company that can help estimate various costs and develop a specific plan.
“If you’re working with a company that doesn’t have those resources available, you’re probably working with a lighting company that doesn’t know what they are doing,” van Iersel said.

Explore the September 2020 Issue
Check out more from this issue and find your next story to read.
Latest from Greenhouse Management
- Anthura acquires Bromelia assets from Corn. Bak in Netherlands
- Top 10 stories for National Poinsettia Day
- Langendoen Mechanical hosts open house to showcase new greenhouse build
- Conor Foy joins EHR's national sales team
- Pantone announces its 2026 Color of the Year
- Syngenta granted federal registration for Trefinti nematicide/fungicide in ornamental market
- A legacy of influence
- HILA 2025 video highlights: John Gaydos of Proven Winners


